Urban Heat Task Force
What is the problem?
Extreme heat is becoming an increasingly dangerous threat to urban residents. However, unlike hazards such as storm surges, communities lack basic knowledge of where extreme heat threats are likely to have the most impacts, and who is most likely to be most affected. In the United States, studies consistently find that historically disenfranchised populations tend to be at greater risk of injury or death during heat events (Hamstead et al., 2018; Voelkel et al., 2018; Hoffman et al., 2020). Spatial variation in microclimates could account for part of this vulnerability (Hamstead et al., 2016; Voelkel and Shandas, 2017), as can uneven access to resources and other social determinants of health. As temperatures increase globally and urbanization processes cause local microclimates to become hotter, residents will be at greater risk of mortality, morbidity, and reduced quality of life.
Heat exposures and sensitivities are produced by systems of politics, economics, culture and infrastructure (Hamstead & Coseo, 2020); thus, individual action may be insufficient to reduce vulnerability to extreme heat. However, regulatory structures such as flood control districts or ambient air quality standards do not exist for extreme heat. Moreover, heat risks are produced by properties of the hazard itself, combined with multi-scale (community, household, and individual-level) processes that shape neighborhoods’ physical and social environments, residents’ and communities’ access to cooling, and other adaptive measures (Makido et al., 2019). Professionals across a wide range of sectors (including those not traditionally viewed as having explicitly responsibilities in the management of extreme heat-related hazards) may be crucial collaborators for mitigating heat vulnerability. Thus, decision makers working in local level (e.g. cities, counties, districts, etc.) need systematic tools for understanding distributions of extreme heat vulnerability across geographies and social groups, and integrating those into professional practice across a wide range of governance sectors (Hamstead et al., 2020).
How are we addressing the problem?
Approaches for addressing the problem focus on understanding distributional patterns of heat risk, comparing heat risk and determinants of heat risk across cities, and developing management tools and frameworks for systematically addressing heat risk.
Heat Sensing and Distribution Mapping Approaches
Thermal sensing and sensitivity: We combine ambient temperature sensing with resident interviews to connect heat exposure with sensitivity.
Landscape-based extreme heat assessment: We use fine scale landscape data and granular demographic information to map heat exposure in historically disenfranchised populations. This enables us to identify landscape interventions for mitigating those exposures.

Figure 1: Methodological Framework. Exposure is Indicated by Surface Temperature Hot Spots; Sensitivity is Indicated by Demographics, and Vulnerability is Defined as Overlap Between the Two, Within Which Landscape-based Interventions Should be Prioritized. (From Hamstead, et al., 2018).
Heat wave analysis: We analyze attributes of heat waves from 10 cities from 1950–2016 to understand how these attributes determine variability in local heat waves and how climate change affects heat waves across the United States. We found at least five harmful attributes of heat waves have increased simultaneously for Dallas, Miami, New York, Phoenix, and Portland. Miami showed the greatest change in heat wave season length, frequency, and timing over the study period. Surprisingly, the greatest mean heat wave intensities above daily thresholds were for Bismarck, ND (+8.2 °C) and Syracuse, NY (+6.5 °C). (Shafiei Shiva, et al., 2019)

Figure 2: Each of the eight segments corresponds to a heat wave property. Within the segments, the smallest to largest rings represent increasing intensities, from mild to extreme, with the color in each ring indicating the temporal trend for each heatwave property.
Heat wave model downscaling: We examine the fitness of 32 downscaled models from CMIP5 and their ensemble median to predict a set of heatwave descriptors across the CONUS by analyzing their capabilities in the simulation of historical heatwaves during 1950–2005. Then, we use a multi-criteria decision-making tool and rank the overall performance of each model for 10 locations with different climates. We found global climate models (GCMs) have different capabilities in the simulation of historical heatwave characteristics. In addition, we observed similar performances for GCMs over the areas with partially similar climates. We identify EC-EARTH as one of the most promising GCMs for the prediction of extreme events in the United States (Shafiei Shiva, et al., 2020).
Assessment of thermal comfort of bus riders in South Mountain Village: We used microclimate measurements and surveys at bus stops in a historically marginalized Phoenix neighborhood to understand summer heat exposure of bus riders.
The Heatmappers Walk in Edison Eastlake: We participated in a public science project in collaboration with Arizona State University, the Nature Conservancy, and the Museum of Walking to establish a baseline of thermal comfort in a low-income neighborhood slated for redevelopment. We measured microclimate conditions along neighborhood streets, surveyed walkers, and collected their physiological data to uncover relationships between prolonged heat exposure and body responses. We collected participants’ heat perceptions to improve the understanding of how a variety of street infrastructure affect outdoor thermal comfort.
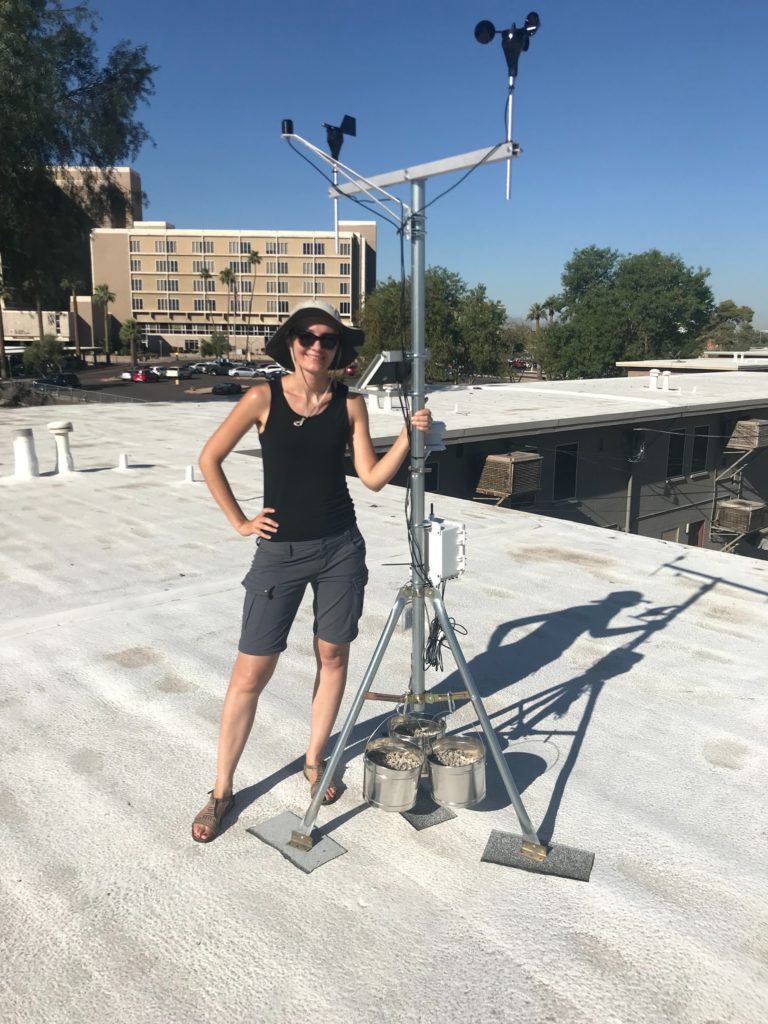
Sensing microclimate in Edison Eastlake: Seven weather stations were deployed for long-term data collection to understand the differences in a neighborhood’s microclimate before and after the redevelopment. Real time sensor data is available here.

Assessment of thermal comfort of bus riders in Hermosillo: We measured microclimate conditions at bus stops around the city of Hermosillo to better understand heat exposure of bus riders during the hottest months. By surveying riders, we helped identify preferred infrastructure for cooling.
Tracking thermal conditions inside buses: We measured air temperature in 12 buses with and without air conditioning to identify differences in heat exposure during bus rides.
Perceptions of heat related challenges in public transit system: We interviewed 20+ public transit stakeholders to improve the understanding of challenges in relation to extreme summer heat
Future Scenarios Modeling
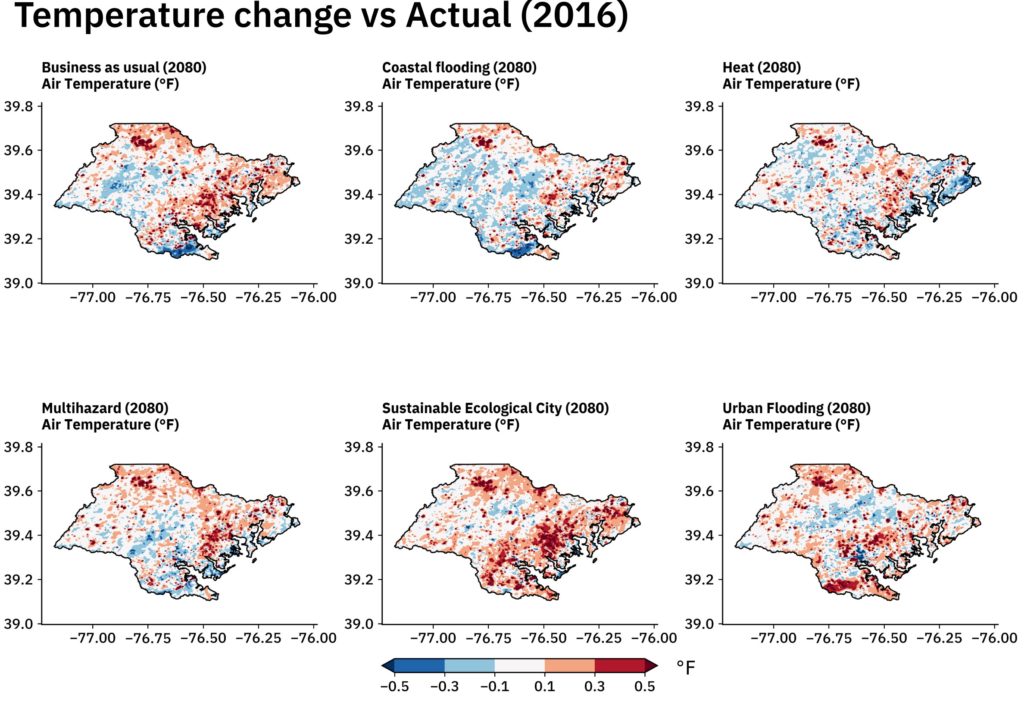
Co-produced future land-use scenarios under extreme heat: We integrated a land-use model with stakeholder-driven visions of the future to create transformative and spatially explicit land-use maps of the cities of Baltimore and San Juan. We used these scenarios to drive a regional climate model (RCM) and simulate the response of near-surface air temperatures during the July 2019 heat wave.

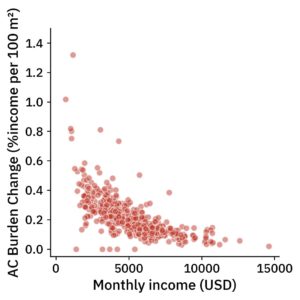
Energy burden of air conditioning use in NYC: Through a combination of urban climate simulations which include building infrastructure and air conditioning adoption, we estimated economic burdens associated with summer home cooling both in the present and end-of-century scenarios.

Management Frameworks
Healthy Urban Environments (HUE) is a solutions-focused research, policy and technology incubator. This initiative is designed to leverage activities initiated under the UREx project in the Phoenix region. As such, HUE rapidly develops, tests and deploys heat-mitigation and air-quality improvement strategies and technologies. In collaboration with practitioners and community members HUE will create healthier communities across Maricopa County. Deploying a regenerative operational model that uses technology and policy outcomes to fertilize future research and development, HUE will translate air quality and urban heat-related research into policy action, novel technology, and commercialized intellectual property. The HUE initiative is sponsored by Maricopa County Industrial Development Authority.
Partnering with The KAITEKI Center, a University-Industry partnership between Arizona State University and The Global KAITEKI Institute (of Mitsubishi Chemical Holdings Corporation), the research team will advance mitigation of urban heat through three main actions:
(1) Modeling the impact of alternative roof surface coatings and paving technologies
(2) Developing novel asphalt pavement binders to integrate reflective properties
(3) Demonstrating mitigation approaches
Thermally-Resilient Communities Collaborative

Figure 3: Application of the Thermally-Resilient Communities Collaborative (TRCC) framework to design of a linked research-practice inscription process for protecting communities against the impacts of heat and cold.
References
Hamstead, Z., Coseo, P., 2020. Building policies, plans, and cities to manage extreme weather events: Perspectives from Urban Planning and Landscape Architecture, in: Smith, K.H., Ram, P.K. (Eds.), Transforming Global Health: Interdisciplinary Challenges, Perspectives and Strategies. Springer Nature Switzerland, Cham, Switzerland, pp. 261–283. doi:10.1007/978-3-030-32112-3
Hamstead, Z., Coseo, P., Alkhaled, S., Boamah, E.F., David, M., Middel, A., Rajkovich, N., 2020 (in press). Thermally resilient communities : creating a socio-technical collaborative response to extreme temperatures. Buildings and Cities. 1–18.
Hamstead, Z.A., Farmer, C., McPhearson, T., 2018. Landscape-Based Extreme Heat Vulnerability Assessment. J. Extrem. Events 05, 1850018. doi:10.1142/S2345737618500185
Hamstead, Z.A., Kremer, P., Larondelle, N., McPhearson, T., Haase, D., 2016. Classification of the heterogeneous structure of urban landscapes (STURLA) as an indicator of landscape function applied to surface temperature in New York City. Ecol. Indic. 70. doi:10.1016/j.ecolind.2015.10.014
Hoffman, J., V Shandas, and N Pendleton, 2020. The Effects of Historical Housing Policies on Resident Exposure to Intra-Urban Heat: A Study of 108 US Urban Areas. Climate 8(1), 12.
Makido, Y., Hellman, D., & Shandas, V. (2019). Nature-Based Designs to Mitigate Urban Heat: The Efficacy of Green Infrastructure Treatments in Portland, Oregon. Atmosphere, 10(5), 282.
Shafiei Shiva, J., Chandler, D. G., & Kunkel, K. E. (2019). Localized changes in heat wave properties across the United States. Earth’s Future, 7(3), 300-319.
Shafiei Shiva, J., & G Chandler, D. (2020). Projection of Future Heat Waves in the United States. Part I: Selecting a Climate Model Subset. Atmosphere, 11(6), 587.
Voelkel, J., & Shandas, V. (2017). Towards Systematic Prediction of Urban Heat Islands: Grounding Measurements, Assessing Modeling Techniques. Climate, 5(2), 41.


