Authors
- Drew D. Canfield – University at Buffalo
- Grace E. DeSantis – University at Buffalo
- Zoé A. Hamstead – University at Buffalo
Purpose
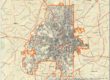
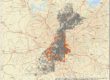
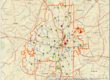
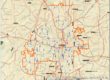
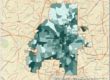
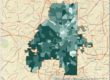
The San Juan Temperature Index Map indicates the normalized (between low (0) and high (1)) surface temperature scale.
Description
The San Juan Temperature Index Map was created by averaging 10 dates from 2014 (1/28/14, 3/17/14, 4/18/14, 5/4/14, 7/7/14, 8/8/14, 9/9/14, 10/27/14, 11/28/14, 12/30/14) and indexing the average surface temperature (Celsius) between 0 (low) and 1 (high).
Spatial Scale: 10 meter
Type: Raster
Year: 2014
Attributes
Surface Temperature Index