Authors
- Drew D. Canfield – University at Buffalo
- Grace E. DeSantis – University at Buffalo
- Zoé A. Hamstead – University at Buffalo
Purpose
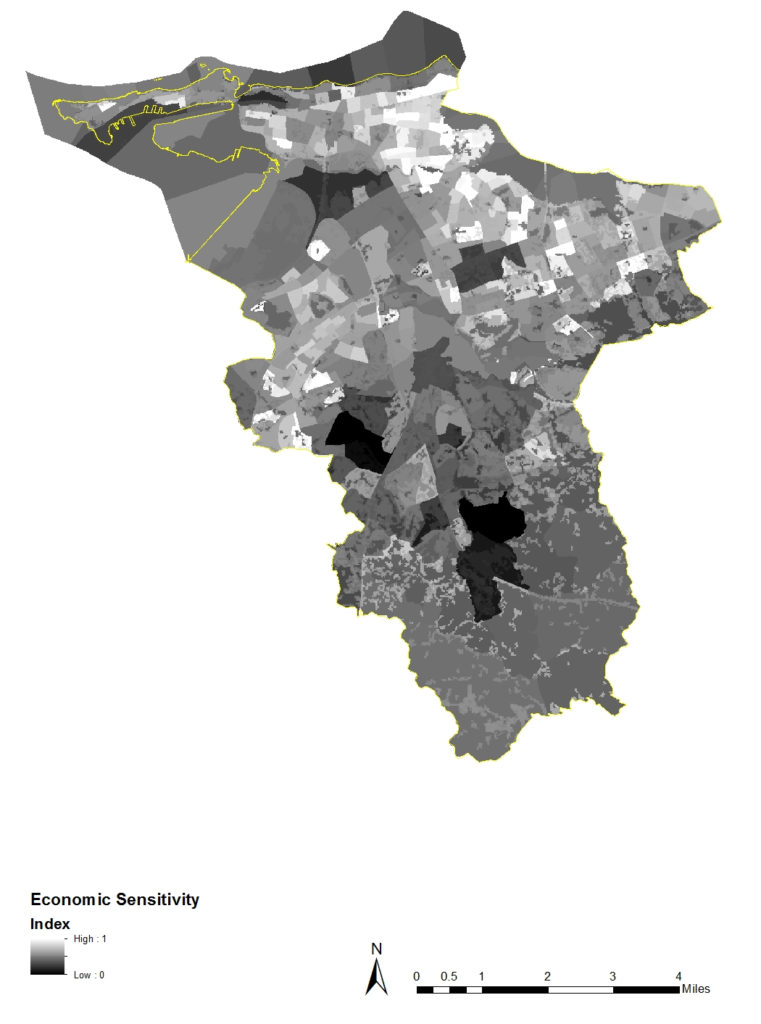
The San Juan Economic Index Map indicates the normalized (between low (0) and high (1)) spatial concentration of the population living in poverty, population unemployed, and households living below the median household income.
Description
The San Juan Racial/Ethnic Index Map created by combining the population living in poverty, population unemployed, and households living below the median household income ((“Poverty” + “Unemployment” + “Median Household Income”) / 3) and then re-indexed between 0 (low) and 1 (high) (INDEX = ([DASY_DENSITY] – minValue) / (maxValue – minValue)).
All census data used to construct population indices was derived from ACS 2012 5-Year Estimates.
The 2001 National Land Cover was used to determine population residence.
Spatial Scale: 10 meter
Type: Raster
Year: 2012
Attributes
Sensitivity to heat index indicated by:
- Poverty Status
- Income Below the Median Income
- Unemployment Status


